Classroom Activity: How Far? How Small?
Main Idea: Students will use a
simple set up to measure the change in the apparent
size of an object as it moves away from them.
Learning Objectives:
- Observe how the height of an object appears to decrease as it
moves away.
- Measure the apparent height of an object at several distances
as it moves away.
- Graph the relationship observed.
- Describe and communicate a mathematical rule for the
size-distance relationship.
Time: 30 to 45 minutes
Materials: Each 2-person team will
need:
- scissors
- an 8 x 12 card
- a pencil
- a strip of stiff cardboard at least 30cm long
- a table at least 1m across
- a simple object such as a bottle or box 25-30cm tall
- a tape measure
- an easy to read ruler
- a copy of the How Far? How Small? Data
Sheet
Skills Needed:
- Measurement accurate to the nearest 0.5cm
- Converting common fractions to decimals
- Graphing
Preparation: Each team should construct
a viewer to improve the consistency of their measurements.

1. Measure and cut out a square with 1cm sides from near the middle
of one end of the index card.
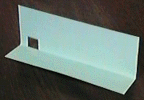
2. Fold the index card lengthwise along the bottom of the square
hole, then open the fold to a right angle.
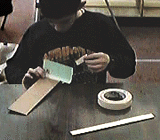
3. Tape the folded card to the end of the cardboard strip aligning
the hole with the right edge of the strip. Make sure the tape does
not block the hole.
 Procedure:
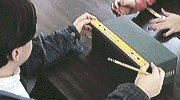
1. Measure the actual height of the object to the nearest 0.5cm and
record it in decimal form.
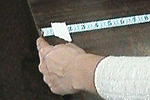
2. Stretch out a tape measure across a table so that 0 cm is even
with the near edge of the table. Use tape to secure the tape measure
in place.
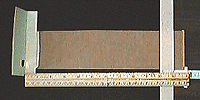
3. Place the viewer at right angles to the table edge and aligned
with the tape measure. Make the index card stick out exactly 10 cm.
Secure the viewer with tape.
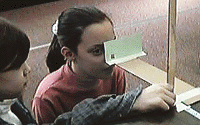
4. Sit or kneel on the floor and put one eye next to the hole in the
viewer.
5. Hold or prop the ruler vertically, 0 end down, at the edge of the
table so you can read it through the viewer.
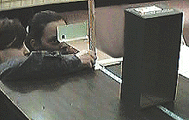
6. Have your partner move the object 10 inches away along the tape
measure. Look through the viewer and note where the top edge of the
object now appears to be on the ruler. Using the Data
Sheet, record this as the apparent height in decimal form.
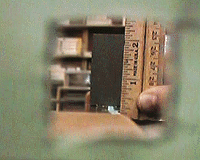
7. Move the object away to 20, 30, 40, 50 and 60 cm. View and record
the apparent height at each location.
8. Switch roles with your partner to collect a second set of
data.
Analyzing the Results:
- Make a graph of distance away versus apparent height.
- Use your graph to make a prediction about the object's
apparent height at a distance you did not test. Then check your
prediction by actually making a measurement at that
distance.
- Make a prediction from your graph about how far away your
object would need to be to look one inch tall. If your table is
long enough, test this prediction as well.
- Divide the actual height by the apparent height for each
distance. The result is a ratio you can use for comparison with
other teams who used different sized objects.
Drawing Conclusions:
- From your graph and/or ratios, describe the rule or
relationship you found between the apparent height of the object
and its distance away from you.
Science Learning Network / email: sln@mos.org
/ © 1997 The Museum of Science


 Procedure:


